Maps R Us

Blog Archive

  • ▼  2008 (53)
    • ▼  October (26)
      • Map# 51: Remote Sensing Mapping
      • Map# 50: Star Plots
      • Map# 49: Correlation Matrix
      • Map# 48: Similarity Matrix
      • Map# 47: Stem and Leaf Plot
      • Map# 46: Box Plot
      • Map# 45: Histogram
      • Map# 44: Parallel Coordinate Graph
      • Map# 43: Triangular Plot
      • Map# 42: Windrose
      • Map# 41: Climograph
      • Map# 40: Population Profile
      • Map# 39: Scatterplot
      • Map# 38: Index Value Plot
      • Map# 37: Lorenz Curve
      • Map# 36: Nominal Area Choropleth Map
      • Map# 35:Standardized Choropleth Map
      • Map# 34: Univariate Choropleth Map
      • Map# 33: Bivariate Choropleth Map
      • Map# 32: Unclassed Choropleth Map
      • Map# 31: Classed Choropleth Map
      • Map# 30: Range Graded Proportional Circle Map
      • Map# 29: Continuously Variable Proportional Circle...
      • Map# 28: Digital Ortho Quarter Quads (DOQQ) Map.
      • Map# 27: Digital Elevation Model (DEM)
      • Map# 26: Digital Line Graph (DLG)
    • ►  September (25)
    • ►  August (2)

Wednesday, October 8, 2008

Map# 27: Digital Elevation Model (DEM)


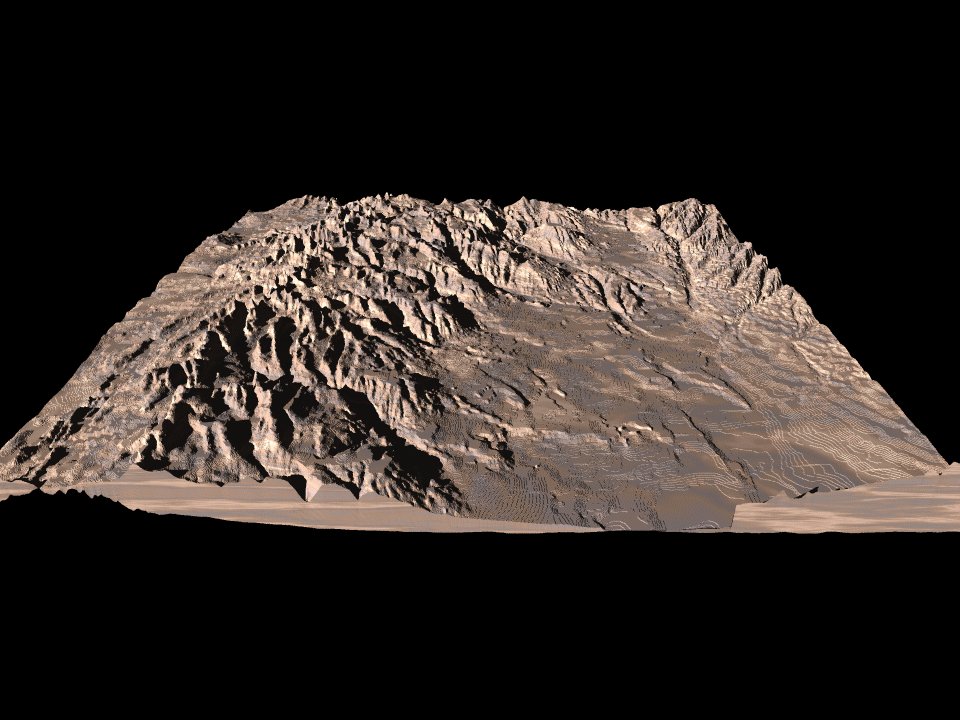
DEMs are the most used basis for digitally produced relief maps. These maps are a digital representation of ground surface topography or various terrain. They are formed from either land surveying or, more often, remote sensing techniques. They are also called digital terrain models. Notice the level of detail that is obtained on the DEM map above.
Posted by Map Nut at 2:00 PM

No comments:

Post a Comment

Newer Post Older Post Home
Subscribe to: Post Comments (Atom)