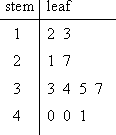
A Stem and Leaf Plot organizes data in order to show its shape and distribution. In this instance, the number 12 is depicted as 1 under the stem, and 2 under the leaf. Likewise, 13 is depicted as 1 under the stem and 3 under the leaf. This stem and leaf plot shows a distribution of 2 values between 10 and 19, 2 values between 20 and 29, 4 values between 30 and 39, and 3 values between 40 and 49. The largest distribution is between 30 and 39. This plot can be found at the following web site: http://www.glencoe.com/sec/math/studytools/cgi-bin/msgQuiz.php4?isbn=0-02-833050-1&chapter=2&lesson=6
No comments:
Post a Comment